Glucose Tolerance Test
Definition, types & detailed procedure, indications, interpreting the different glucose curves, factors affecting the result.
CLINICAL & APPLIED BIOCHEMISTRYDIABETES MELLITUS
8/29/20242 min read
Glucose Tolerance Test
The Glucose Tolerance Test (GTT) is a diagnostic tool used to evaluate how well the body processes glucose.
Process and Method
Preparation:
The patient is advised to maintain a normal carbohydrate diet (at least 150g/day) for 3 days before the test.
Fasting for 8-12 hours is required before the test, with only water allowed.
Procedure:
Baseline Measurement: A fasting blood sample is taken to establish a reference glucose level.
Glucose Administration: The patient consumes a glucose solution (usually 75g dissolved in water for adults).
Subsequent Blood Draws: Blood samples are collected at regular intervals (e.g., every 30 minutes for 2-3 hours) to monitor glucose levels.
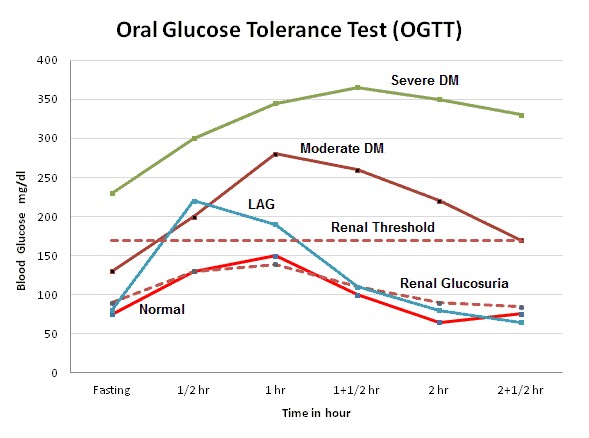
Analysis: The blood glucose levels are plotted on a graph to observe the body's response.
Graphical Representation:
The graph typically shows time on the x-axis and blood glucose levels on the y-axis.
A normal response shows a peak in glucose levels followed by a return to baseline within 2 hours.
Abnormal responses (e.g., delayed return to baseline) may indicate conditions like diabetes or impaired glucose tolerance.
Clinical Applications
Diabetes Diagnosis:
GTT is commonly used to diagnose Type 2 diabetes, prediabetes, and gestational diabetes.
It helps identify insulin resistance and impaired beta-cell function.
Gestational Diabetes:
Pregnant women are often screened using a modified GTT to detect gestational diabetes, typically between 24-28 weeks of pregnancy.
Rare Conditions:
GTT can help diagnose reactive hypoglycemia, acromegaly, and other carbohydrate metabolism disorders.
Research and Monitoring:
It is used in research settings to study glucose metabolism and in clinical practice to monitor the effectiveness of diabetes treatments.
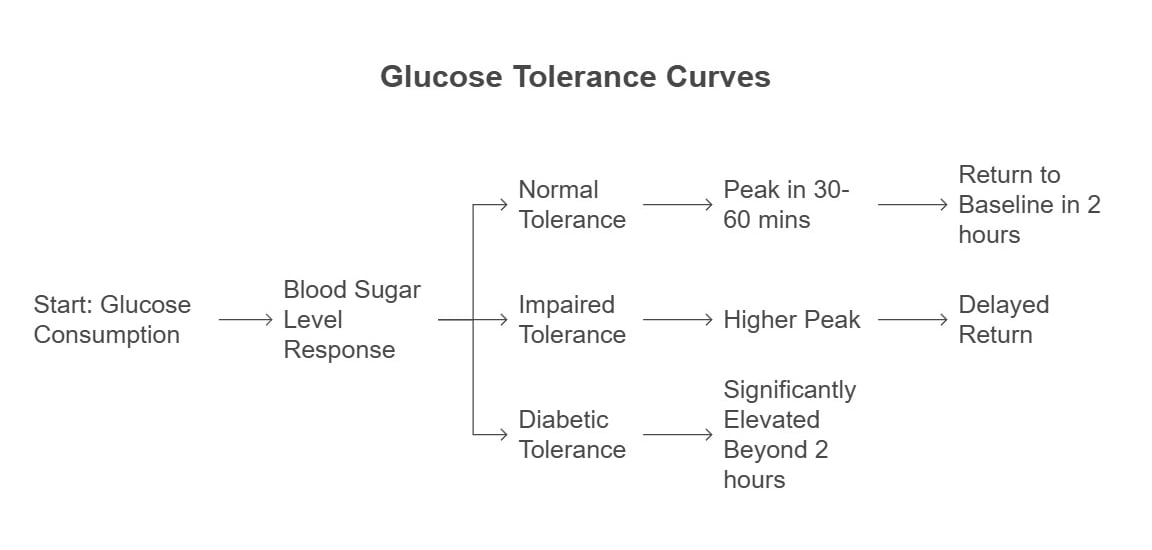
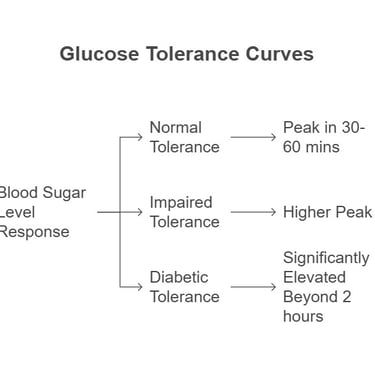
Graphical Representation:
Normal Glucose Tolerance Curve:
After consuming glucose, blood sugar levels rise and peak within 30–60 minutes.
The levels then gradually return to baseline within 2 hours.
Impaired Glucose Tolerance Curve:
Blood sugar levels rise higher than normal and take longer to return to baseline.
This indicates a reduced ability to process glucose efficiently.
Diabetic Glucose Tolerance Curve:
Blood sugar levels rise significantly higher and remain elevated beyond 2 hours.
This is a hallmark of diabetes.
Insights into Interpreting Results:
Fasting Blood Glucose:
Normal: <92 mg/dL
Impaired: 92–125 mg/dL
Diabetic: ≥126 mg/dL
2-Hour Blood Glucose:
Normal: <140 mg/dL
Impaired: 140–199 mg/dL
Diabetic: ≥200 mg/dL
These curves and thresholds help clinicians diagnose conditions like diabetes, prediabetes, and gestational diabetes.
BLOG
Explore the medical biochemistry intricacies.
WRITE TO US
© 2024. All rights reserved.